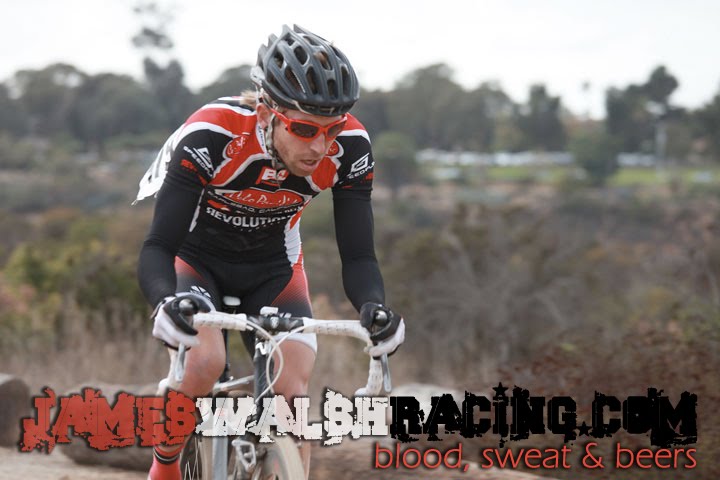
I rearranged my schedule quite a bit last week with the prediction for a rainy couple of days. I got my long ride of the week in Tuesday (new years day) so I wasn't stressing about getting in any long rides. There is no way in hell I could spend 4 hours on the trainer like Jim. It didn't start raining until early Saturday morning and I was able get out on the mountain bike on Friday.
Friday morning ride. Right out the back door.

Friday night's dinner. Killer steak salad. Beth was on the veggies and being the man that I am I took care of the steak.
killing it.

pre-grill.

post-grill.

let's eat.

It was nasty Saturday morning so I hit the 24 hour fitness and got in a 40 minute treadmill run with some "cruise" intervals in zone 3. Later on Beth and I headed to Coastal Sports & Wellness Medical Center for a group indoor ride with the Tri Club. The put the ride together to showcase Coastal Sports facility and to get in miles for the USAT Club competition. We spent 2 hours with pur butts glued to saddle and plugged into the computrainer. There were probably 20-30 people all grinding it out together. It was a good workout and considering the alternative of sitting in my garage alone for 2 hours I was stoked.

Sunday I woke up pretty early and noticed it wasn't raining so I threw on my running gear on got on it.
Long run done. 1:07 in zone 2. solid.

One of the highlights of the week was the new version of Cycling Peaks being release, which is now called Training Peaks WKO+. You can now add in all your running and if you are using GPS it will calculate a running Training Stress Score (rTSS). I played around with it a lot this weekend and added all my runs since I got back into training on December 1st. I can now get an accurate picture of my training stress (combined cycling and running), which is rad if you are a tech geek like me. Here are some of the new graphs that incorporate running.
Running: AVG Pace vs. AVG HR

Custom Performance Management Chart with 1 min and 20 min peak power outputs.


.jpg)


5 comments:
I've never seen so many graphs without a math textbook in front of my face. Haha!
Wait, are you telling me that when it's high 50s and raining you ride inside??!
That's crazy talk!
Up here in Seattle, high 50s and rain is a balmy winter morning, perfect for riding!
What are you using to record your data, HR, elevation, distance?
thanks
I'm sorry did you post something else down there, something with numbers and graphs. I could focus on anything else but the steak...hmmmm steak.
Beeeeeeeeef... is there nothing it can't do?
Sweet training tools bro! I especially love the chart showing HR vs pace... VERY cool!
Breathe...
Post a Comment